Maths dictionary
Linear functions and straight-line graphs (y = mx + c)
A linear function is a function whose graph is a straight line, y = mx + c. Here is what the gradient m and the y-intercept c mean, with a taxi ride as the example.
Functions grow in many different ways, and each way describes how something develops in real life. It could be how the money in a bank account grows with a certain interest rate, or how the price of a taxi ride grows for every kilometre you drive. Money in a bank account and a taxi ride are described by different types of function, but when we talk about linear functions, we mean things that grow linearly. That is, the graph of the function is a straight line. A lot of situations out in the real world are described by what we call a linear function.
The equation of a linear function
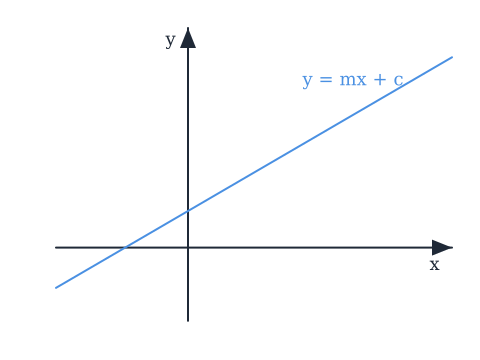
Every type of function has its own equation, a form the function has to fit before it counts as that type. A linear function has the equation
This says that the function value, , is equal to the matching -value multiplied by a number , plus a constant . You will often see the same line written as in other books. The letters are different, the line is exactly the same. In the UK the gradient is called and the constant is called , so that is what we use here.
What m and c mean
In the equation there are two values we don't know to begin with, and .
is the gradient of the line. The gradient of a straight line is defined as how far we go up the y-axis when we go 1 along the x-axis. In the picture you can see the definition of what the gradient is.
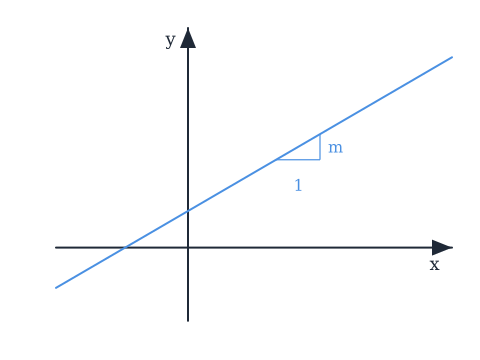
As you might guess, that means the bigger is, the steeper the line. The gradient tells us something about how much the function slopes. If the line went 4 up the y-axis every time it goes 1 along the x-axis, would be 4. We can also have gradients that are negative. Then the graph slopes downwards, and for every 1 we go along the x-axis, the line goes down instead of up.
is rather simpler. It describes where the function crosses the y-axis.
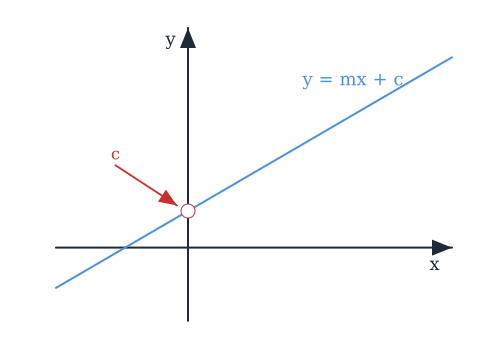
If the function hits the y-axis at 2, is 2. We call the y-intercept. The guide on gradient and y-intercept goes through both of them with more examples and pictures.
Why c is where the line crosses the y-axis
How do we know that describes the crossing with the y-axis? All the points on the y-axis have one thing in common: their -values are all 0. That is what it means to be on the y-axis. So if we want to find the place where the function is on the y-axis, we just put 0 in 's place in the equation of the line:
We can see that the term with disappears completely, because it is multiplied by 0, and so we only have left:
We have now shown that the crossing point between the y-axis and our straight line is exactly what describes.
Setting up a linear function
Let's take an example with both and . Say a function goes 5 up the y-axis when it goes 1 along the x-axis, and the function crosses the y-axis at 3. Then we can set up the function:
is 5 because the function goes 5 up the y-axis when it goes 1 along the x-axis. is 3 because the function crosses the y-axis at 3.
Linear functions in real life
When we work with linear functions in real life, a meaning like "crossing with the y-axis" can seem a bit odd. A taxi ride helps. Say a taxi costs £2 per km, and there is a start fee of £4. Every kilometre adds £2 to the price, and that is exactly what is: how much we go up the y-axis when we go 1 along the x-axis. The start fee is what we pay before we have driven anything at all, so that is where the price starts on the y-axis, our . The function for the price becomes
That is also why GCSE calls the gradient a rate of change: here it is the £ per km. The whole example, with the graph, is in the guide on gradient and y-intercept.
Finding the equation from two points
Often we need the gradient of a linear function without being told it. Typically we have been given two points on the line instead. For that there is a formula, which funnily enough is called the two-point formula:
Once we have , we find by putting one of the points into the equation. The full walkthrough is in the guide on finding the equation of a straight line from two points.
Straight lines through data
Sometimes we don't have a neat line at all, just a lot of points from measurements, and we want the straight line that describes those points as well as possible. That is called linear regression, or at GCSE a line of best fit. It is not a different topic: it just finds the and of the line that fits best. See the guide on scatter graphs and the line of best fit.
Common misunderstandings
- "m is just a number you multiply by." It is that, but it is also a picture. is how far the line goes up (or down) every time you move 1 to the right. If you can read that off a graph, you can read off .
- "c is where the word problem starts, so it changes as you go." No. is where the line crosses the y-axis, the value when is 0. In the taxi example is the £4 start fee, and you pay it no matter how far you drive.
- "£6 for 3 km means the gradient is 6." No. The gradient is how much we go up when we go exactly 1 along the x-axis, not 3. £6 for 3 km is £2 per km, so is 2. Always rewrite the information so it says how much grows for 1 step in .
- "A line of best fit is a different kind of maths." It isn't. Linear regression just finds the and of the straight line that fits a set of points best.
Related guides
- Gradient and y-intercept: what m and c mean
- Finding the equation of a straight line from two points
- Scatter graphs and the line of best fit
- A linear function is a type of function, and direct proportion is a linear function with .
Guides on this topic
Finding the equation of a straight line from two points
Given two points on a line, the two-point formula gives you the gradient m, and putting one point back in gives you c. Here is the whole method, and why the formula looks the way it does.
Gradient and y-intercept: what m and c mean
In y = mx + c the gradient m says how far the line goes up for every 1 along, and c says where it crosses the y-axis. Here is how to read both off a graph and out of a taxi fare.
Scatter graphs and the line of best fit (linear regression)
A line of best fit is the straight line that describes a scatter of points as well as possible. Here is what it is for, how to judge how well it fits, and when a straight line is the wrong choice.
Frequently asked questions
Read next
Want to get good at maths?
Mathara explains every topic step by step with videos, exercises and personal feedback.
👉 Get started for free