Maths, explained so it makes sense
Look a concept up in the dictionary, or follow a guide step by step. Everything is written so it's actually easy to understand.
 4 min.
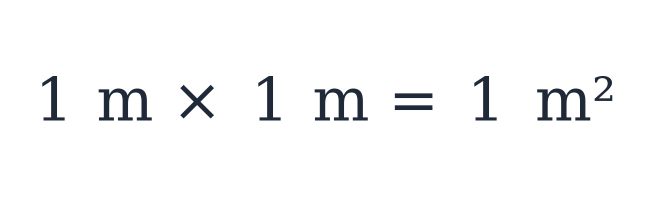
 Units: metres, square metres and cubic metres
A unit is a way of describing how much there is of something. When we multiply lengths, the units get multiplied too, and that is where square metres and cubic metres come from.
 4 min.
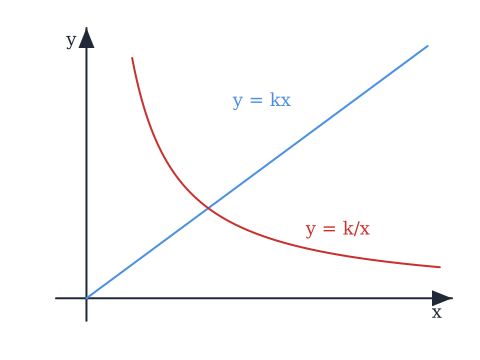
 What is proportion? Direct and inverse proportion
Proportion is a relationship between x and y where y grows in a very particular way. There are two kinds, direct (y = kx) and inverse (y = k/x), and here is what they mean.
 5 min.
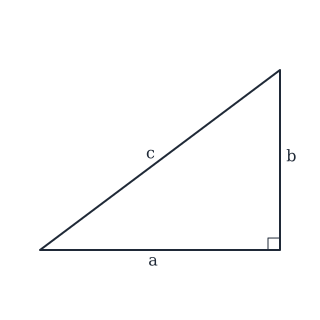
 Pythagoras' theorem
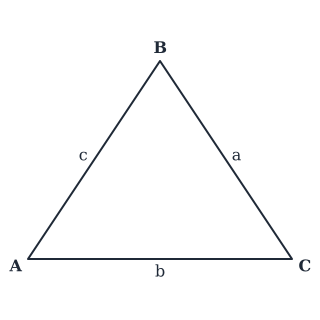
Pythagoras' theorem is a kind of formula that says how the side lengths in a right-angled triangle are related. Here is what a² + b² = c² means, with the sides named and one worked example.
 8 min.
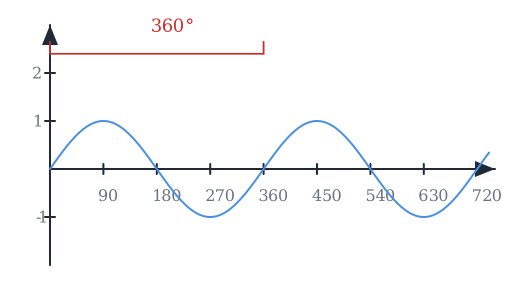
 The graphs of sine, cosine and tangent
The graphs of sine, cosine and tangent all come from the unit circle. Here is why sine makes a wave that repeats every 360 degrees, why cosine is the same wave shifted, and why tangent breaks apart at 90 degrees.
 6 min.
 Triangles: types, angles and properties
A triangle has three corners, three angles that always add up to 180 degrees, and a handful of names worth knowing. Here are the types of triangle, the special lines inside them, and the two circles that belong to every triangle.
 6 min.
 What is probability?
A probability is not a guess. It is the number of outcomes we want divided by the number of outcomes there are. Here is the short explanation with a dice, a drawer of socks and a coin.
 6 min.
 Quadratic functions and the parabola
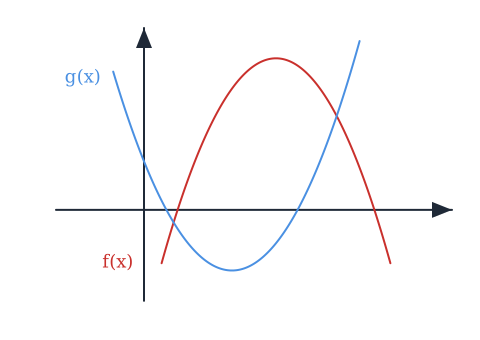
A quadratic function is written f(x) = ax² + bx + c, and its graph is a parabola with one turning point. Here is what the three numbers a, b and c do to the graph, and what the roots are.
 6 min.
 Linear functions and straight-line graphs (y = mx + c)
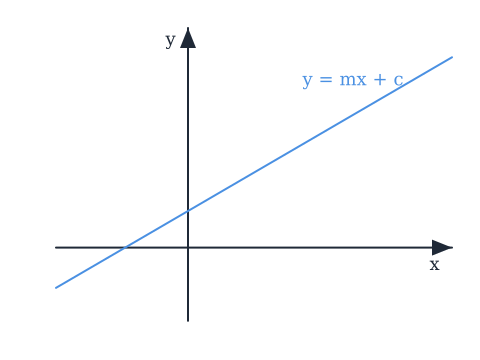
A linear function is a function whose graph is a straight line, y = mx + c. Here is what the gradient m and the y-intercept c mean, with a taxi ride as the example.
 3 min.
 What is an inequality?
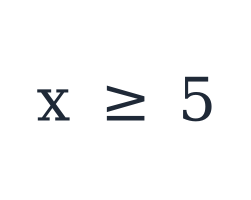
An inequality is almost the same as an equation, but instead of an equals sign it has a greater-than or less-than sign. We solve it the same way, with one small difference, and the answer is a whole range of values instead of one.
 7 min.
 The gradient of a curve: average and instantaneous rate of change
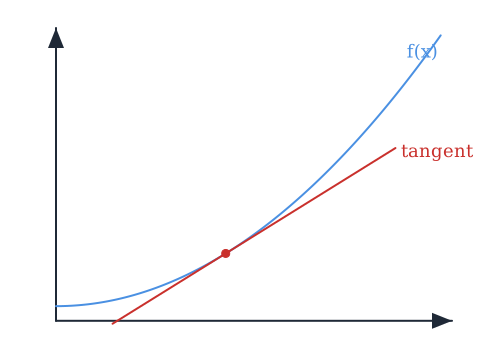
On a straight line the gradient is the same everywhere. On a curve it changes from point to point. The gradient formula between two points gives the average rate of change, and the gradient of a tangent gives the rate of change at one instant, like the needle on a speedometer.
 5 min.
 Exponential functions: growth and decay
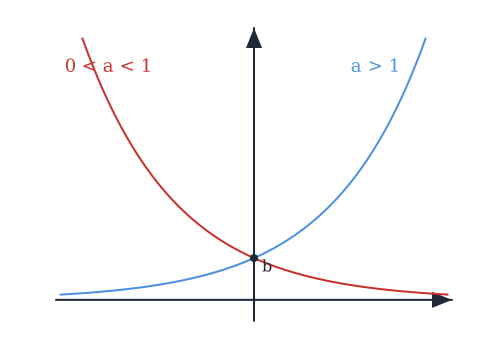
An exponential function has the equation f(x) = b × a^x, where b is the start value and a is the growth factor, a = 1 + r. Here is what the two shapes of the graph mean, when the function is not exponential at all, and why the graph never reaches zero.
 7 min.
 What is a fraction?
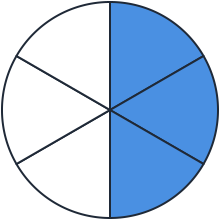
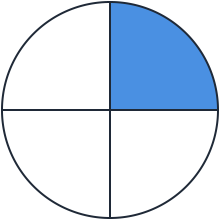
A fraction is made of three parts, a numerator, a fraction bar and a denominator, and the fraction bar is just a division sign. Here is the short explanation with examples and pizza.
 5 min.
 What are indices (powers) and roots?
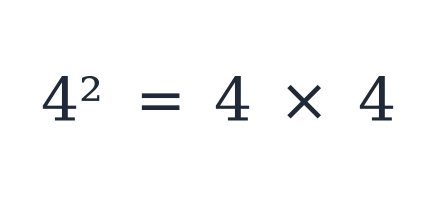
A power has two parts, a base and an index, and the index just tells you how many times to multiply the base by itself. Roots run the same thing backwards. Here is the short explanation with examples.
 3 min.
 Power functions: graphs of y = b times x to the power a
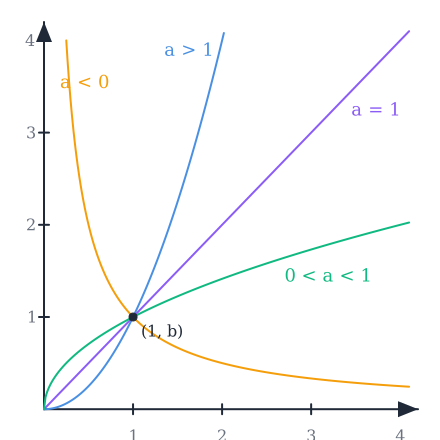
A power function has the equation f(x) = b × x^a. Unlike an exponential function, the index a stays fixed and x is the base. Here is what b and a mean and the four shapes the graph can take, which is where the cubic graph and the reciprocal graph live.
 7 min.
 Trigonometry: sine, cosine and tangent
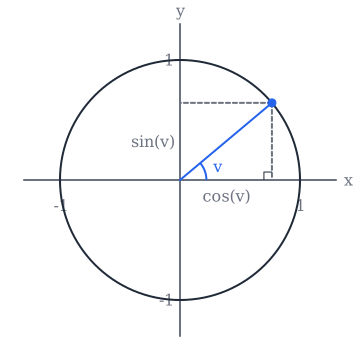
Sine and cosine are simply the coordinates of a point on the unit circle, and tangent is built from them. Once you see that, the formulas for triangles stop being things to memorise.
 4 min.
 The different types of numbers
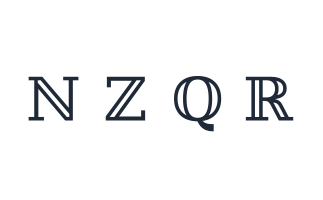
Numbers come in groups that nest inside each other: the natural numbers, the integers, the rational numbers and the real numbers. Here is what each group contains and how each one is built from the one before.
 5 min.
 Simplifying algebraic expressions: terms and like terms
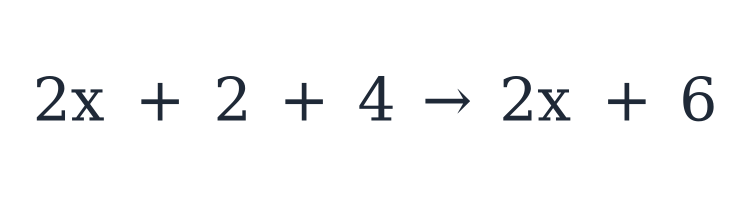
Simplifying is a way of making maths easier to get an overview of. We work out as much as we can, but we're not allowed to add apples and bananas: 2a + 3a becomes 5a, and 2a + 5 has to stay as it is.
 4 min.
 What are decimals?
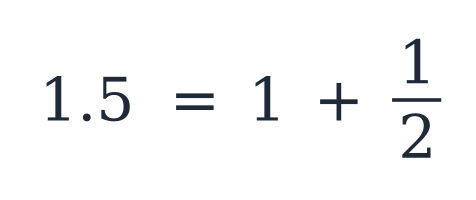
A decimal is a way of writing a number that isn't whole. The digits after the decimal point are parts of a whole: tenths, then hundredths, then thousandths. Here is the short explanation with examples.
 4 min.
 Quadrilaterals: square, rectangle, parallelogram and trapezium
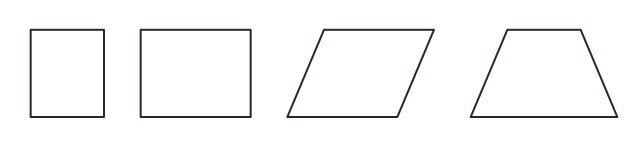
Every quadrilateral has 4 sides and an angle sum of 360 degrees. Here are the four shapes worth knowing, what makes each one different, and the area formula that goes with it.
 5 min.
 Counting outcomes: tree diagrams and the product rule
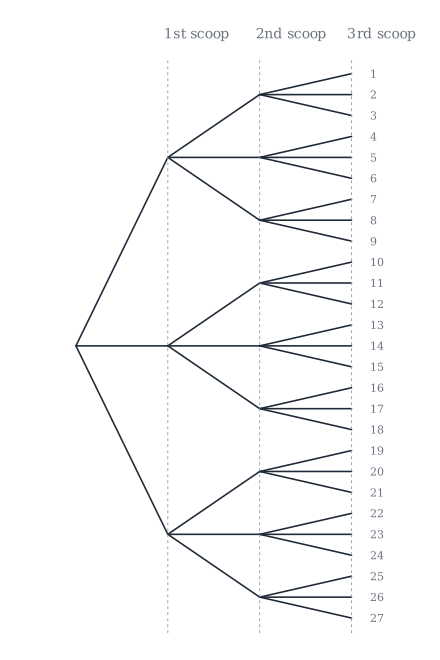
How many ways can you combine 3 scoops of ice cream from 3 flavours? A tree diagram shows all 27. When the tree gets too big, the product rule and the factorial take over.
 5 min.
 Coordinate geometry: lines, distances and circles
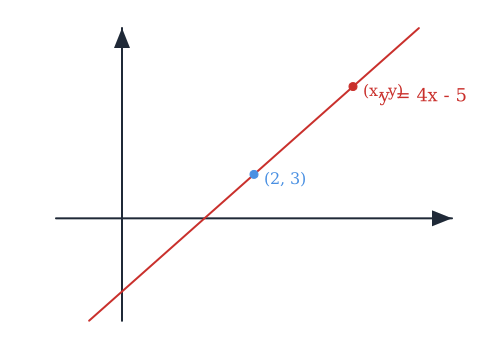
Coordinate geometry is about describing figures like lines and circles with equations and coordinates. Here is the line through a point with a given gradient, the distance and midpoint between two points, parallel and perpendicular lines, and the equation of a circle.
 3 min.
 Scale and scale drawings
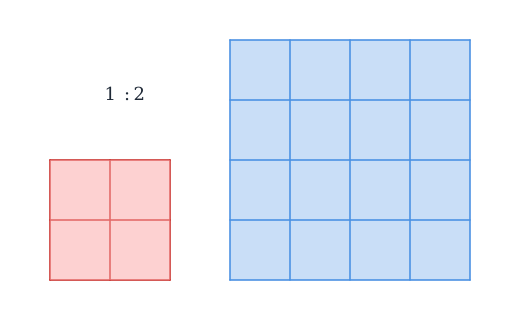
Real things are often too big for a piece of paper, so we scale them down and write the scale as 1 : x. Here is what the two numbers mean, and which one is the drawing.
 5 min.
 What is a percentage?
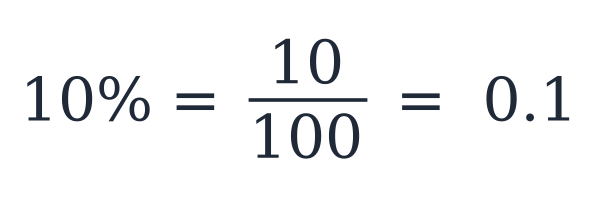
Per cent means hundredths, so every percentage is a fraction with 100 on the bottom. Here is what that means, and the four kinds of percentage question you will meet in GCSE maths.
 6 min.
 What is a function?
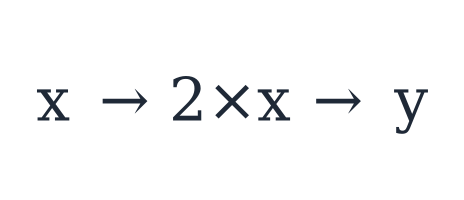
A function is like a machine in a factory. We put a number in, the machine applies its rule, and a different number comes out. That one picture carries everything else about functions.
 5 min.
 What is a vector?
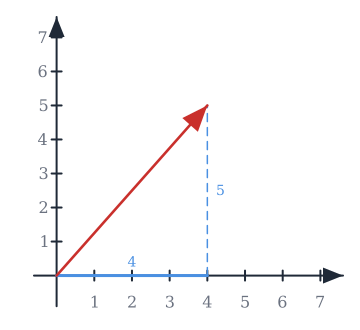
A vector is an arrow with a direction and a length. Its coordinates say how far it goes across and how far up, and two arrows with the same length and direction are the same vector, wherever they sit.
 5 min.
 Circles: radius, diameter, chord, circumference
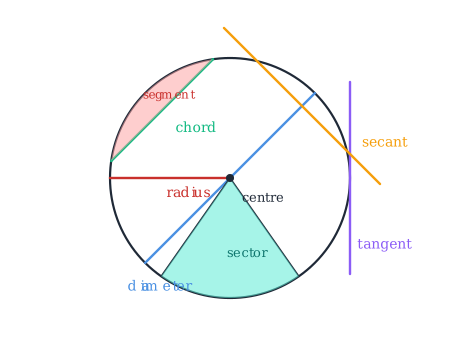
The circle is probably the simplest shape we have: round, no corners, 360 degrees all the way round. Here are the names of its parts and the two formulas you need for it.
 4 min.
 Order of operations (BIDMAS)
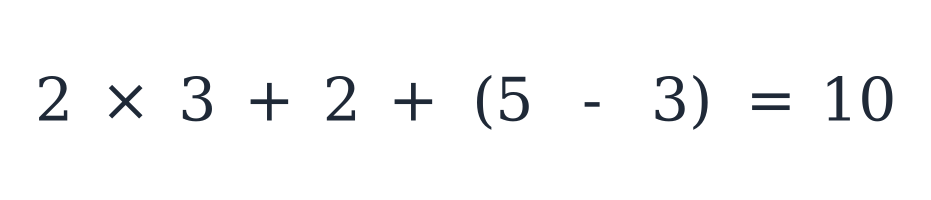
Before you can learn any maths, the basics have to be in place. The order of operations is a pyramid: brackets first, then powers and roots, then multiplying and dividing, and finally adding and subtracting.
 5 min.
 Transformations: reflection, translation and rotation
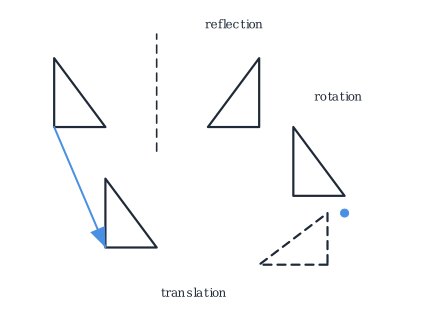
Reflection, translation and rotation are three ways of moving a figure. The figure keeps its shape every time: it is mirrored, pushed or turned, never changed.
 5 min.
 3D shapes: volume and surface area
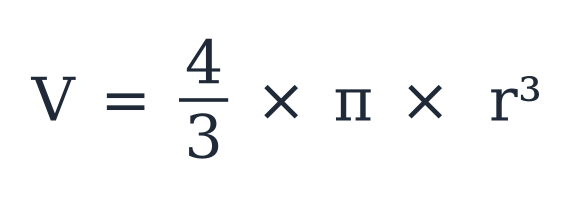
Volume is how much fits inside a 3D shape. Surface area is how much wrapping paper you would need to cover it. Here is the catalogue of shapes and their formulas.
 7 min.
 What is an equation?
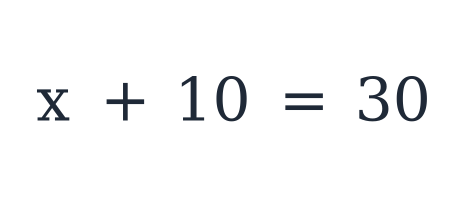
An equation is a way we can find unknown values. The equals sign says both sides are exactly the same, like a scale in balance, and solving means doing the opposite on both sides until x stands alone.
 7 min.
 Statistics: organising and describing data
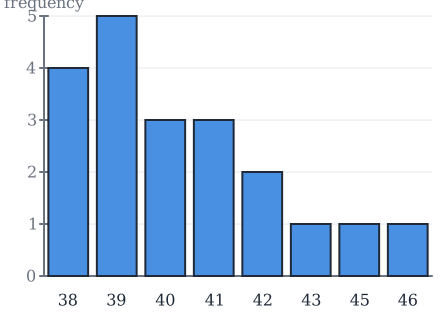
Statistics is about getting an overview of data. We collect observations, put them in a frequency table, draw them, and then describe them with a few numbers such as the mean, the median and the quartiles.


© 2026 Matmedlassen ApS