Maths dictionary
Exponential functions: growth and decay
An exponential function has the equation f(x) = b × a^x, where b is the start value and a is the growth factor, a = 1 + r. Here is what the two shapes of the graph mean, when the function is not exponential at all, and why the graph never reaches zero.
Just like linear functions, exponential functions come with their own equation. The equation for an exponential function is:
Here is where the graph crosses the y-axis (the start value), and is what we call the growth factor. The growth factor shows how many per cent the function grows or falls by, because it's defined as
where is the percentage the function rises or falls by, written as a decimal. The reason we add is that we have to put this percentage rise or fall on top of the we already have. So we can also write the equation of an exponential function like this instead:
The bank example
The best example of an equation like this is when you have money sitting in a bank. Let's say you start with £. The bank has been really kind and gives you interest a year, which means that every year you get added on top. Our start value is the £, and our r-value is the , which is as a decimal:
What we have on the x-axis is how many years go by, since you get interest per year. When you put a particular number of years in for , you find out how much money you have in the account after that many years. Say you'd like to know for years, so when is . We put in for :
So we have £ in the account after years at interest. The guide exponential growth and decay takes this step by step, including what happens when something falls by a percentage instead. The same formula is what the compound interest guide uses with and .
Growth or decay: what a tells you
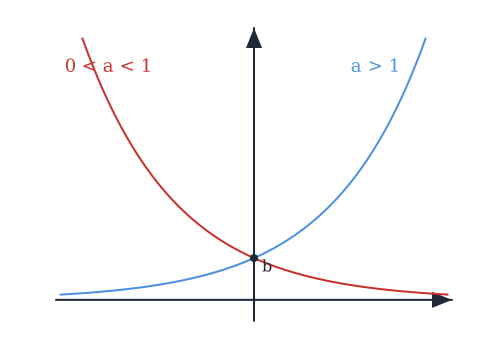
As we saw, an exponential function grows by percentages. When is bigger than , the function grows: that's the blue curve on the graph above, which starts near zero on the left and shoots up to the right. When is between and , the function falls by a percentage every step instead: that's the red curve, which starts high and flattens out towards zero. Both are exponential functions. The growth factor tells you which one you have, and the start value is where both curves cross the y-axis.
When is it not an exponential function?
An exponential function grows with percentages, and that's one of its properties. That's also why not every a-value is allowed. If were , we'd see:
which makes this function stop growing or falling by any percentage. It's just , and that means it's no longer an exponential function. Not an especially exciting function either. If the b-value were , we'd also get a fairly dull function, namely
So we're no longer dealing with an exponential function when or is . The same actually applies if is :
We can see that whatever x-value we have, we just get , since raised to anything at all is . When is , we simply get , which again isn't exponential growth, because it's just a constant function.
More formally, you can say that an exponential function holds when and are greater than , and isn't equal to :
What the graph does far to the left
Are we allowed to put negative x-values in? Let's try putting into the function:
When we have a negative index, we can also write it as a fraction:
We've rewritten as , which is one of the laws of indices. Nothing wrong with that. So whatever negative number we put in, it's allowed. If we'd used , we'd have got
As you can see, that gives a very small fraction, because the denominator is enormous. So we can say: the bigger the negative number gets, the smaller the y-value gets (when the a-value is bigger than ). How do we know the y-value gets smaller? Well, the b-value gets multiplied by this fraction, and the smaller the fraction is, the smaller the whole thing gets too. A good idea is to go back and look at the figure with the two exponential functions at the start. Then you can see that it makes sense.
And because and are positive, the y-value always comes out positive. It can get very close to , but it never actually becomes . The y-value can get infinitely big, but it can never be . That's why the graph flattens out towards the x-axis without ever touching it.
Exponential functions and power functions
One thing to be aware of is the difference between exponential functions and power functions. In the sits in the index. In a power function, , it doesn't: there the is the index instead. The graphs can look alike, but they're different kinds of growth.
Common misunderstandings
- " for growth." The growth factor is , so gives . The is the you already have.
- " is fine." With you get , a constant, not an exponential function.
- "Only counts as exponential." is exponential too. That's decay: the function falls by a fixed percentage every step.
- "You can't put negative in." You can. is just .
- "Far to the left the graph reaches ." It gets as close as you like but never gets there. The y-value can never be .
Related guides
Guides on this topic
Frequently asked questions
Read next
Want to get good at maths?
Mathara explains every topic step by step with videos, exercises and personal feedback.
👉 Get started for free