Maths dictionary
What is a function?
A function is like a machine in a factory. We put a number in, the machine applies its rule, and a different number comes out. That one picture carries everything else about functions.
A function is like a machine in a factory. We put something into it, and something else comes out on the other side.
That's the whole idea, and it's worth holding on to, because everything else about functions is just this machine looked at from different angles.
The machine
Depending on what the function looks like, different things will of course come out. When we talk about functions in maths, we call the thing we put in the x-value and the thing that comes out the y-value.
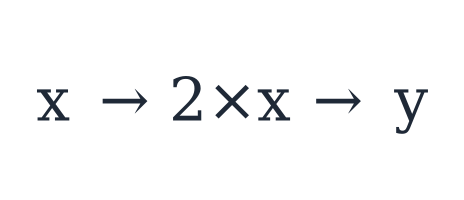
So an x-value goes into the function, and a y-value comes out on the other side. The y-value that comes out depends on the x-value.
Let's look at an example: a function called . That means that when we put an x-value (a number) into the function, we multiply our x-value by 2, and that becomes the y-value. Let's try putting 3 into the function:
We put 3 into the function, and since the function is called , we put 3 in x's place and work it out. So we get a y-value, and it's 6. Notice how the y-value depends on the x-value. If we'd put 5 in x's place instead, we'd have got a different y-value:
Writing a function as y = 2 × x
When we write functions in maths, we can't be bothered to draw the machine every time, so we write it like this:
That's a lot easier to write, and it means exactly the same as our machine. It just says that we find our y-value by saying 2 times the x-value. So if we try putting 3 into the function again, it says
which we can work out to
In the exam the multiplication is usually written with a cross, , or with nothing at all, . It's the same function.
Why x and y are called variables
and are what we call variables, because they vary, that is, they change. We can choose our x-value ourselves, and depending on which x-value we put into the function, the y-value changes too, so it isn't the same two values all the time. You can see it as and just being placeholders for some numbers we haven't chosen yet.
Because the y-value depends on which x-value we choose, we call the dependent variable, and , which depends on nothing except what we pick, the independent variable. We see that all the time in the real world: in a taxi the price depends on how far you drive. There's a guide on dependent and independent variables that takes this properly.
Where functions live: the coordinate system
When we want to visualise functions, we need somewhere to do it. Just like when you paint, you need a canvas. In maths we also have a kind of canvas, which we call a coordinate system. It's two axes at right angles to each other, the horizontal x-axis and the vertical y-axis, meeting in the middle at the origin. A point in it is described by how far along the x-axis and how far up the y-axis we have to go, written as . The guide on coordinates and the coordinate system builds that picture up one step at a time.
From the machine to a graph
There's actually a close connection between functions and the coordinate system. When we put an x-value into the function, we actually get a point. Put 3 into and the y-value turns out to be 6, so
which, after all, is just like the coordinates of a point:
So when we work out particular values in a function, we can visualise them as points in a coordinate system. Let's take the x-values 1, 2, 3, 4 and 5 and work out the y-values:
All we've done is put the different x-values we chose into the function and worked out the y-value for each one. So we get five points: , , , and .
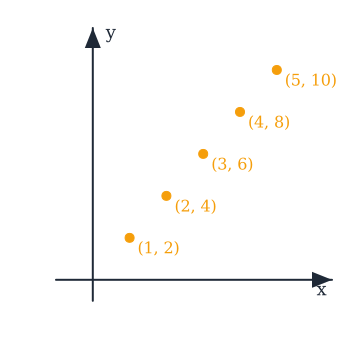
As we can see, the function makes a pattern. It's as if, no matter which x-value we put into the function, the point always ends up lying on one line.
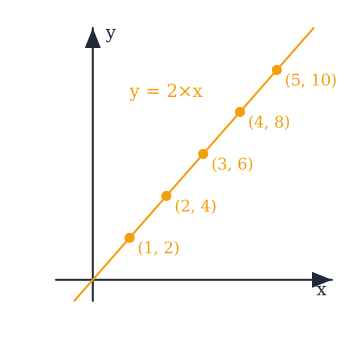
That line is actually what we call the function's graph. If we pretend that we plotted points for infinitely many x-values, we'd get exactly this line. So when we visualise a function, we do it with a graph, and every function has one. We can use it to see how the connection develops, and even read values straight off it. The guide on plotting a graph from an equation goes through the whole thing, including a real-life example.
Another way to write a function: f(x)
There are many ways to write functions. You probably already know , which is the one we typically use, but there are also lots of other names we can use. Instead of
we often write
It means exactly the same. is really just what we name our function, and with the bracket we show which variable our function depends on. The advantage is that we can write to mean the function value when is 3. That gets its own guide on function notation.
Where this leads
Once the machine picture sits right, a few more moves come naturally:
- Putting one machine's output into another machine: composite functions.
- Running the machine backwards, which is actually what we do every time we solve an equation: inverse functions.
- Moving a whole graph up, down or sideways: translating graphs.
Functions whose graph is a straight line, like , get their own article on linear functions and straight-line graphs.
Common misunderstandings
- "A function is just an equation." A function is the machine. is the label on its box: it tells you what the machine does to whatever you put in.
- "f(x) means f times x." No. is only the name we give the function, and the bracket shows which variable the function depends on. is the function value when is 3, not .
Related guides
Guides on this topic
Composite functions
Composite functions are exactly what the name says: we put one function into another. Take the whole of g(x) and put it in x's place in f(x), and you have f(g(x)).
Coordinates and the coordinate system
The coordinate system is the canvas we draw functions on. A point is described by how far we go along the x-axis and then up the y-axis, written as (x, y).
Dependent and independent variables
The y-value that comes out of a function depends on the x-value we put in. That gives the two variables their names, and it decides which one goes on which axis.
Function notation: what f(x) means
f(x) is just another name for y. The f names the function and the bracket shows which variable it depends on, which is why f(3) is such a handy way to say the function value when x is 3.
How to plot the graph of an equation
Every x-value we put into a function gives us a point. Plot a handful of them, draw the line through them, and you have the graph. Here is the method with y = 2x and a real-life example.
Inverse functions
Two functions are inverse when they cancel each other out. Squaring and square root, times 2 and divide by 2, plus 10 and minus 10. Every time you get x on its own in an equation, this is what you are using.
Translating graphs: f(x) + k and f(x − k)
There are two ways to translate a graph: up the y-axis or along the x-axis. Up is easy, you add to the function. Sideways is the one that catches people, because moving right means subtracting from x.
Frequently asked questions
Read next
Linear functions and straight-line graphs (y = mx + c)
DictionaryWhat is an equation?
GuideDependent and independent variables
GuideCoordinates and the coordinate system
GuideHow to plot the graph of an equation
GuideFunction notation: what f(x) means
GuideComposite functions
GuideInverse functions
GuideTranslating graphs: f(x) + k and f(x − k)
Want to get good at maths?
Mathara explains every topic step by step with videos, exercises and personal feedback.
👉 Get started for free