Guide
Dependent and independent variables
The y-value that comes out of a function depends on the x-value we put in. That gives the two variables their names, and it decides which one goes on which axis.
In a function the y-value depends on the x-value, and that is what gives the two variables their names: the dependent variable and the independent variable. The maths here is small. The thing people trip over is remembering which one is which, so let's take it straight from the machine.
When do I use this?
Every time we describe a function, draw its graph or read a real-life situation as a function. If you haven't met the machine picture yet, read What is a function? first, because this guide leans on it.
Which one depends on which?
As we saw in the examples in the article on functions, it was the y-value that got spat out of the machine, depending on which x-value we put into the function. So depending on which x-value we choose, different y-values come out. That's why the y-value is a dependent variable: it depends on what the x-value is.
At the same time, the x-value doesn't depend on anything other than what we choose. That's why we call it the independent variable.
So the rule is short. The value we pick is independent. The value that comes out is dependent.
We see it all the time in the real world
This is actually something we see really often out in the real world. If you take a taxi, the price depends on how far you drive. So the price is dependent on the number of miles. The distance is the independent variable, because you decide how far you're going, and the price is the dependent variable, because it follows from the distance.
Or if you have a part-time job, your wage depends on how many hours you work. The hours are the independent variable and the wage is the dependent variable.
Which axis each variable goes on
In our coordinate system we always have the independent variable on the x-axis and the dependent variable on the y-axis. That's not a detail, it's the whole reason a graph reads the way it does.
Take the graph of the price of cinema tickets from the guide on plotting a graph, where one ticket costs £10:
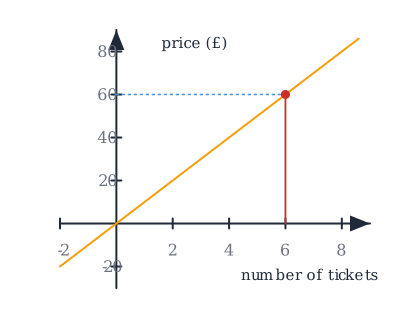
When we look at this graph, we can see that we have the number of tickets on the x-axis and the price on the y-axis. That's because the price depends on how many tickets we buy, so the price is the dependent variable, and that's why we put it on the y-axis. The number of tickets doesn't depend on anything, so it's the independent variable, and it goes on the x-axis. Remember that we always want the dependent variable on the y-axis and the independent variable on the x-axis.
Once the variables sit on the right axes, reading the graph is easy: go to 6 on the x-axis, up to the line, and across to the y-axis, and you can read off that 6 tickets cost £60.
Common mistakes
- "The x-value depends on the y-value." It's the other way round. We choose the x-value, and the y-value comes out of the function depending on it. The one we choose is independent, the one that comes out is dependent.
- "It doesn't matter which axis I put things on." It does. The independent variable always goes on the x-axis and the dependent variable on the y-axis, otherwise the graph tells the story backwards.
Related
Frequently asked questions
Read next
Want to get good at maths?
Mathara explains every topic step by step with videos, exercises and personal feedback.
👉 Get started for free