Guide
Coordinates and the coordinate system
The coordinate system is the canvas we draw functions on. A point is described by how far we go along the x-axis and then up the y-axis, written as (x, y).
Coordinates tell us exactly where a point sits, using two numbers: how far along, and how far up. The hurdle is almost always the same one, mixing up which number is which, so this guide builds the point up from scratch instead of just handing you the bracket.
When do I use this?
Whenever we want to draw a function, read a graph, or say where something is in a diagram. Everything in the guide on plotting a graph from an equation rests on this.
The canvas
When we want to visualise functions, we need a place to do it. Just like when you paint, you need a canvas. In maths we also have a kind of canvas, which we call a coordinate system.
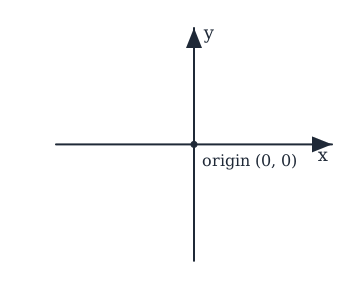
The coordinate system consists of two different axes, which stand at right angles to each other. The horizontal axis we call the x-axis, and the vertical one we call the y-axis. The middle of the coordinate system we call the origin, and it's from there that we measure everything. In our coordinate system we always have the independent variable on the x-axis and the dependent variable on the y-axis (more on that in the guide on dependent and independent variables).
Describing a point
Here's a point drawn in the coordinate system. The way we describe where that point lies is by measuring how far we have to go along the x-axis, and up the y-axis, before we reach the point. Here we have to remember that we start at the origin, which has exactly the coordinates , right in the middle of the whole coordinate system.
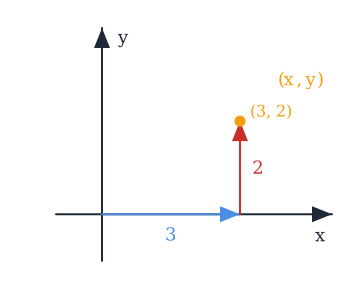
We describe a point with an x-coordinate and a y-coordinate, which we set up in a bracket:
and in our example the coordinates of the point are
The blue arrow is the 3 along the x-axis, the red arrow is the 2 up the y-axis. The point is built out of those two measurements, and the bracket just writes them down in that order.
Worked example: plotting (2, 5)
Let's take an example where we have to plot a point called
It looks like this:
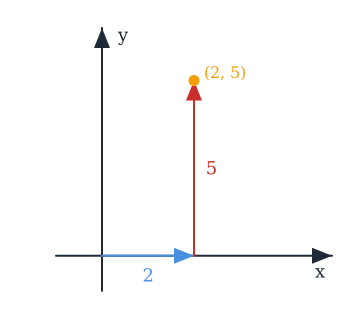
We have to go 2 out along the x-axis first, and then 5 up the y-axis. That's the whole procedure: along first, up second, and the point is where you end up.
The axes carry on the other way too
In the pictures above the axes keep going to the left of the origin and below it. That's where the negative numbers sit. On the graph of a ticket price in the plotting guide the x-axis is marked with to the left of the origin and the y-axis with below it. So a point out on that side simply has a negative coordinate, and you plot it exactly the same way, just going left instead of right, or down instead of up.
Common mistakes
- "The first number is how far up." No. The first number in the bracket is the x-coordinate, how far along the x-axis, and the second is the y-coordinate, how far up. is 2 along and 5 up, not 5 along and 2 up.
- "I can start measuring from anywhere." We always start at the origin, . Both numbers in a coordinate are measured from there.
Related
Frequently asked questions
Read next
Want to get good at maths?
Mathara explains every topic step by step with videos, exercises and personal feedback.
👉 Get started for free