Maths dictionary
The graphs of sine, cosine and tangent
The graphs of sine, cosine and tangent all come from the unit circle. Here is why sine makes a wave that repeats every 360 degrees, why cosine is the same wave shifted, and why tangent breaks apart at 90 degrees.
Trigonometric functions are actually quite simple. A trigonometric function is a function with something trigonometric in it. That's it: there's just trigonometry inside the function. For example
That's a trigonometric function. And
is also a trigonometric function. What they have in common is that they contain some trigonometry, so sine, cosine or tangent. Before you read on, it's a good idea to have read about trigonometry, because that's where sine, cosine and tangent come from: the unit circle.
Trigonometric functions have some interesting properties, precisely because they're trigonometric. That is, they come from the unit circle. Let's look at some of those properties.
One thing first, about the axis. At GCSE the angle is measured in degrees, so that's what we put along the x-axis. In more advanced maths the angle is measured in radians instead, where a full turn of is written , so you'll often see these graphs drawn with , and so on along the axis. It's the same graph, just a different unit on the axis. Here we stick to degrees.
Periodic functions
Very many trigonometric functions are what we call periodic. That means they run through a certain period before they repeat themselves. When and how they do that depends entirely on the function, so let's look at the classic example. We start with
and look at its graph:
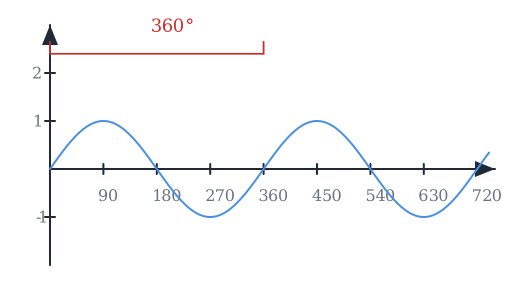
Here we can see that after the graph repeats itself. That's what we call the period. You may also have heard someone call it the oscillation time, but it's the same thing. So the period of is . That means that every time have passed, the graph repeats itself. At the mark, the mark and so on, the graph repeats itself.
It depends entirely on what our trigonometric function looks like. Take, for instance, . Here the speed has been turned up a little, so the function oscillates a bit faster, and that makes the period smaller: the angle is multiplied by , which gives twice as fast an oscillation, so the period is now instead of . And if we slow it down instead and multiply the angle by a smaller number, like , the oscillation time, or period, gets longer. It's now , so pass before the function repeats itself.
The graph of sin(x)
Looking at the graph of , we can see that as the angle (the x-value) gets bigger, the sine value forms a kind of wave. But why it does that is important to understand. So we go back to the unit circle and look at how sine behaves when the angle gets bigger.
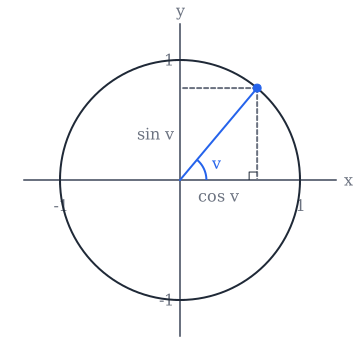
We know that the sine of the angle is the y-coordinate of the point on the edge of the circle. That means, of course, that when the angle changes, that is when the point moves round the edge, the sine value changes too. And that's precisely what the graph of shows. The angle is the x-value. Sometimes you even see the function written instead, with for the angle.
An example could be when the angle is . Then the point is right at the top of the circle, so the sine value is . We can see that on the graph too. That's how the graph of sine hangs together with what happens in the unit circle. If the angle were instead, the sine value is , which we can also see on the graph.
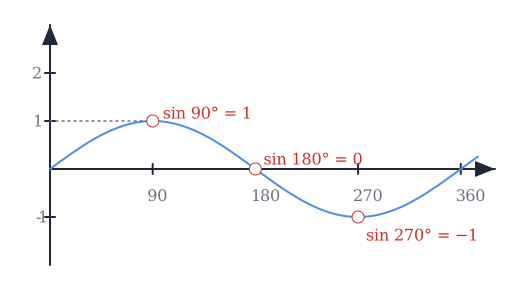
The graph of sine is really just a picture of what happens to the sine value in the unit circle as the point is moved round the edge, that is as the angle gets bigger.
It also makes good sense that the period, the distance it takes before the graph repeats itself, is . By then we've come all the way round the unit circle and start over from the beginning. So of course the graph repeats itself.
The graph of cos(x)
In the same way that the graph of sine is just a picture of what happens to the sine value in the unit circle as the point moves round the edge, the graph of cosine is exactly the same, but for the x-value of the point, that is the cosine of the angle.
An example could be at again. If we look at the x-value of the point in the unit circle, we can see that it's , just as shows on its graph. We have to remember that is the angle. When we connect the graph with the unit circle, it makes sense why the graph looks the way it does.
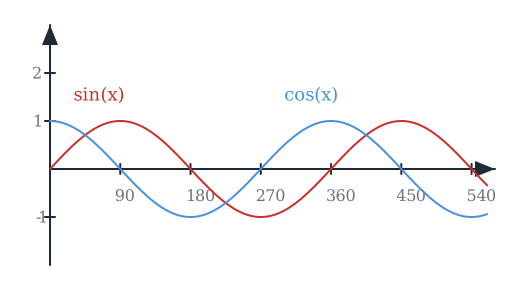
The sine and cosine graphs look very much alike, and if we show them in the same coordinate system, we can see that they're just a shift of each other. Sine starts at , where cosine starts at .
The graph of tan(x)
Tangent has a graph too, of course, but it looks a bit different from the sine and cosine graphs.
Tangent is defined as the y-coordinate of the point where the radius crosses the vertical tangent line at , the line that just touches the circle on its right-hand side. It isn't quite a radius, since it goes out past the edge of the circle, but it's the best way to describe it. In any case we can see that the tangent value, , is the y-coordinate of the crossing point with that line. If this isn't quite clear, read the part about tangent under trigonometry.
As we know from the unit circle, tangent has some problems around and at . That's where the radius no longer crosses the tangent line, so the tangent value is undefined at those two angles. Let's look at what happens to the tangent value as the angle grows:
- is undefined
Here the tangent value starts out small, and even when we make the angle bigger, not much happens at the start. But we can see that the bigger the angle gets, the bigger the change gets too. So the tangent values start to get bigger and bigger. When we get up into the 80s, suddenly huge changes happen, even though the angle only changes a little. Finally we hit , where there is no tangent value, because the "radius" can no longer cross the tangent line, since the two are parallel.
As soon as the angle gets bigger than , we start to get negative tangent values:
That also makes sense in the unit circle, because the crossing with the tangent line now lies below the x-axis. After the tangent value climbs back up towards , quickly at first and then more and more slowly. Exactly the opposite of what happened before .
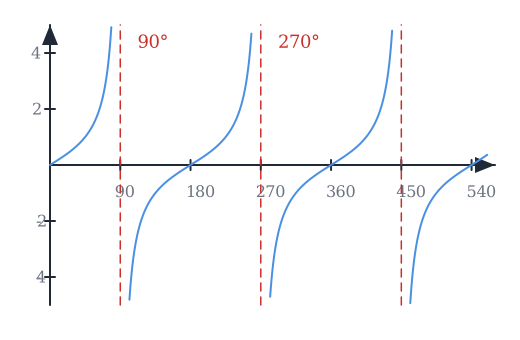
Here we can see the graph of tangent. It looks a bit odd, since it isn't one connected curve, and that actually makes good sense. We remember what happens as we get closer to : the tangent value starts to climb faster. That's exactly what happens on the graph. We get closer and closer to , and the tangent value, the y-value, gets bigger and bigger very fast. As soon as we go past , we get a negative tangent value, and it then heads towards a tangent value of when the angle is . Then the graph starts over, but now heading towards instead.
Common misunderstandings
- "Sine only makes sense for angles between 0° and 90°." That's the triangle way of thinking. In the unit circle the point can go round as far as we like, so , and have a value for any angle, and their graphs just keep going.
- "tan(90°) is infinity." No, it's undefined. At the radius is parallel to the tangent line and never crosses it, so there is no tangent value to read off. The graph has a gap there, not a very tall value.
- "Sine and cosine are two completely different graphs." They're the same wave. Cosine is just sine shifted along, because cosine reads the x-coordinate of the point on the circle where sine reads the y-coordinate. Sine starts at , cosine starts at .
- "The graph stops at 360°." After the point has gone all the way round the circle and starts again, so the graph repeats itself for ever. That's the period.
Related
Where sine, cosine and tangent come from in the first place, the unit circle and right-angled triangles, is in Trigonometry: sine, cosine and tangent. What a function and its graph are is in What is a function?.
Frequently asked questions
Read next
Want to get good at maths?
Mathara explains every topic step by step with videos, exercises and personal feedback.
👉 Get started for free