Guide
Outliers: the 1.5 times IQR rule
An outlier is an observation that lies much further away than the rest. 'Much further away' is vague, so we make it precise with the interquartile range: anything beyond 1.5 times the IQR from the box is an outlier.
Outliers are observations that lie much further away than all the other observations we have in our data set. Now, "much further away" is a pretty poor expression to use, because how do you decide what counts as "much further away"? We do it by looking at the interquartile range. The hurdle in this guide is only arithmetic: keep track of which limit you add to and which you subtract from.
When do I use this?
When a data set has one or two values that look out of place and you need to say, with a calculation rather than a feeling, whether they count as outliers. You need the quartiles first, so read quartiles, interquartile range and box plots if they're new to you. This is one of the last things we do in statistics, because it uses almost everything before it.
The interquartile range
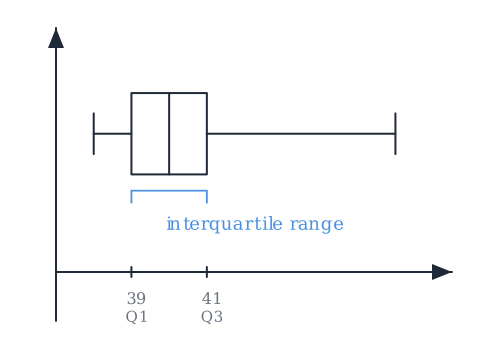
The interquartile range is really just the difference between the third quartile () and the first quartile (). On a box plot it is the width of the box:
The procedure
What we do to decide whether something is an outlier is to multiply this interquartile range by one and a half. Let's say our was 43 and our was 39.
1. Find the interquartile range
So we get an interquartile range of 4.
2. Multiply it by 1.5
3. Add it to Q3 for the upper limit
We add this value to the upper quartile, , to find the upper limit for an outlier. That is, the smallest value something has to have to count as an outlier:
If something in our data set is larger than 49, it is therefore an outlier.
4. Subtract it from Q1 for the lower limit
We can do the same at the lower quartile, . We find the lower limit for an outlier by subtracting the same value from :
If something in our data set is smaller than 33, it is also an outlier.
So with and , everything from 33 up to 49 is ordinary, and anything outside that band is an outlier.
Worked example: the 20 shoe sizes
Now the class from the other statistics guides:
We found and in quartiles, interquartile range and box plots.
- Interquartile range: .
- Multiply by 1.5: .
- Upper limit: .
- Lower limit: .
Nothing in the class is smaller than 36. But 45 and 46 are both larger than 44, so those two shoe sizes are outliers. That matches what the box plot already hinted at with its long right whisker, only now it's a calculation and not a hunch.
Common mistakes
- "An outlier is anything that looks far away." "Much further away" is too vague to work with. Use the calculation: 1.5 times the interquartile range beyond the box.
- "I add 1.5 times the IQR to the median." You add it to for the upper limit and subtract it from for the lower limit. The median isn't used.
- "I multiply the range by 1.5." It's the interquartile range, , not the full range max minus min.
- "A value exactly on the limit is an outlier." The limits are the values something has to be beyond: larger than the upper limit, or smaller than the lower limit.
Related
The interquartile range comes from quartiles, interquartile range and box plots, and the range that outliers stretch is described in mean, median, mode and range. Everything sits under statistics: organising and describing data.
Frequently asked questions
Read next
Want to get good at maths?
Mathara explains every topic step by step with videos, exercises and personal feedback.
👉 Get started for free