Guide
Tree diagrams in probability
A tree diagram draws every way a situation can turn out, one toss at a time. Then you count the paths you want against all the paths. Here it is for a coin tossed 3 times.
A tree diagram is a way we can quickly get an overview of our situation when something happens several times in a row. The usual hurdle isn't the drawing itself, it's remembering that every single branch splits again at the next step, so the number of paths grows fast.
When do I use this?
We use a tree diagram when one event follows another and we want the probability of a particular sequence. In What is probability? we found the probability of a single roll by dividing the favourable outcomes by the possible outcomes. The tree does the same thing for several tosses at once: it draws all the possible outcomes for us, so we can count them.
The procedure
Let's say we toss a coin 3 times. What's the probability that we get heads all three times?
- Start with a point on the left. For the first toss there are 2 outcomes, heads or tails, so we draw 2 branches.
- From each of those outcomes there are again 2 outcomes, so from the end of every branch we draw 2 new branches. Then again for the third toss, and so on for as many tosses as there are.
- Mark what we want. Every time we get heads, we draw the branch green, and every time we get tails, it's red.
- Count the complete paths from the start to the far right. That's all the possible outcomes.
- Count the paths that give what we want. That's the favourable outcomes. Then divide, exactly as for a single roll.
Worked example: heads three times in a row
Here is the tree for our 3 tosses:
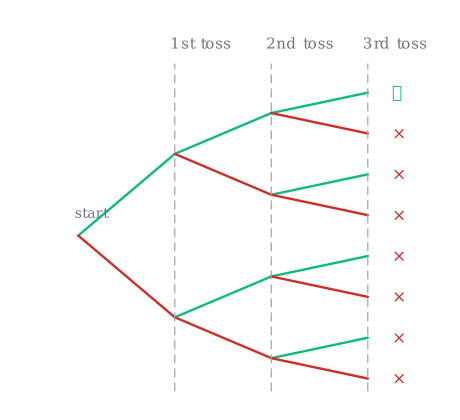
We show how the tosses go with a tree like this. Because we want heads, we mark it with green, and every time we get tails, it's red. Our goal is heads on all 3 tosses, so all 3 have to be green. We can see on the tree that there is only one place where all 3 tosses give heads, so there is 1 out of 8 cases where we toss 3 heads in a row. The probability is
The tree diagram is an easy and clear way to work out probabilities.
Checking the answer by multiplying
We can actually also work the probability out without the tree. We do that by multiplying the probabilities together. If we take the example from before, we find the probability of heads on the first toss. Since there's only heads and tails, that has to be , or . We make 3 tosses in total, so we multiply this probability by itself 3 times:
As we can see, this gives exactly the same probability as we found using the tree diagram.
Multiplying like this only works because each toss is independent of the toss before. That is, the first toss has no influence on what the second toss becomes. That idea gets its own guide about independent events, and the multiplying itself is the and rule in the guide about the and rule and the or rule. If you need a reminder of how to multiply the fractions, see how to multiply fractions.
Common mistakes
- "Heads three times is ." That's the classic mistake. First heads and then heads and then heads is a both-and situation, so we multiply, not add. The tree shows why: there are 8 paths, and only 1 of them is the one we want.
- "I can always skip the tree and multiply." Only when the tosses are independent of each other. Even though it seems simple, it's important to judge whether the events depend on each other before you multiply.
- "The tree works for any number of tosses." It's an easy and clear overview, but each toss splits every branch again, so with many events the tree quickly becomes impossible to draw. That's when the multiplication takes over.
Related
The concepts behind the tree are in What is probability?. The same tree, without the colours, is used to count how many ways things can be put together in Counting outcomes.
Frequently asked questions
Read next
Want to get good at maths?
Mathara explains every topic step by step with videos, exercises and personal feedback.
👉 Get started for free